Here’s something that might surprise you:
When it comes to trend reversals in the forex market, there are three fundamental types you need to understand.
Yep — just three.
And once you understand how each type of reversal develops, you can start to recognise the price-action patterns that are likely to follow when the reversal takes place.
That’s pretty neat, right?
Rather than looking at every reversal as a completely different event, we can break them down into three distinct types and examine what is happening behind the scenes.
In this lesson, we’re going to peel back the layers of these three types of trend reversal and explore what causes each one to develop.
We’ll look at:
- What happens to price as the existing trend begins to weaken.
- Where and when larger market participants, such as banks, may be placing or closing trades.
- How these actions can influence the movement of price.
- What retail traders are likely to see and how they may react as the trend approaches a reversal.
- How the different types of reversal can produce different price-action structures.
The goal isn’t simply to memorise three different patterns.
I want you to understand why each type of reversal forms.
Once you understand the mechanics behind them, you’ll have a much easier time recognising them when they appear on your own charts.
We’ll take each type step by step, starting with the first:
The Consolidation Reversal
This type of reversal is particularly interesting because the market doesn’t simply change direction immediately.
Instead, price begins to consolidate, creating a period of sideways movement before eventually breaking out and establishing a new trend.
Let’s take a closer look at what’s happening during this process and why the consolidation develops in the first place.
For reference, let’s take a peek at an example from the start of 2013 on AUD/USD.

For almost a year, AUD/USD was basically in hibernation mode, consolidating back and fourth before the downtrend started.
So, how does a consolidation reversal begin?
With bank traders start placing trades on one side of the consolidation.
In our above example, the banks are entering sell trades at the upper boundary of the consolidation. The lower boundary? That forms when they take profits off their trades. But it’s not about securing profits; rather, it’s a clever move to move price back up to the upper boundary.
Here’s why:
For bank traders to effectively place all their sell trades into the market, they need to coax retail traders into buying over and pver again. When the market moves to the lower boundary, however, most retail traders are selling because, well, price is falling.
So, for the banks to make price rise again, they need to buy from the traders selling.
The way they do that: taking partial profits.
Placing buy trades wouldn’t work as they’re forecasting a downtrend and already have sell positions in the market.
If they started setting up buy trades, they’d eventually need to close the trade. And when they close their buy trades, it generates downward movement, unintentionally shoving the market away from where they’re aiming to position their sell trades.
Notice the lack of buying until the market has fallen lower?
That’s because the selling witnessed after the market broke the lower boundary of the consolidation comes from traders closing losing long positions. As the market neared the lower boundary, traders would have bet on the market bouncing higher— a pattern previously observed three times.
If you zoom in on the daily candle that ended up breaking the lower boundary, you’ll spot a wick at the top.
That’s a telltale sign that, at some point during the day, the market was on the rise.
Seeing the market’s climb, traders assumed a bounce was starting and began placing long positions, hoping the market would move back to the upper boundary of the consolidation.
However, when the market started its descent, these traders found themselves ensnared in their losing trades. As the market sank lower, traders started to pull the plug on their losing long trades, triggering a substantial amount of downside movement.

The retail traders’ selling can be seen when the market reached the 0.9600 level. The buying here is professional traders taking profits from their own sell positions, established way back when the market was still consolidating.
To take profits, banks need fresh retail traders to step into the market and enter sell trades. This behind-the-scenes action manifests as buying in the market.
Ask yourself: “Who would be buying after such a steep plunge?”
Although the buying was modest and there were no major pullbacks or consolidation, it’s our first red flag of retail traders starting to short the market. As such, we should be on guard a downtrend could be pausing or ending sooner rather than later.
A second example of a consolidation reversal takes place on EUR/JPY, right before the 2008 crash.

Notice how there was a consolidation well before the actual market crash.
Now, doesn’t that make you wonder, “Did the banks see the crash coming?”
Look at the highs forming the upper boundary of the consolidation. They are closely packed; each high doesn’t form far beyond the previous one. When you spot such consolidations, with the highs and lows bunched up, it’s a strong hint professional traders are active.
They could either be closing trades (taking profits) or placing new ones.
The tricky part is, there’s no clear-cut method to figure out whether this consolidation resulted from profit-taking or bank traders orchestrating a trend reversal. However, two indicators can give us some clues: the consolidation’s duration and its context.
In my experience, a consolidation that stretches over a long period, say 25 weeks or more, typically signals that the prevailing trend is likely to stay in place.
Why?
It’s human bias.
People tend to believe the longer something persists, the more likely it is to continue. It’s this bias that causes trends to form and continue over time.
Similarly, if a market stays in a consolidation phase for an extended period, people start to assume it’ll just keep consolidating. That perception can cause traders to lose sight of the trend that preceded the consolidation.
Before entering a consolidation phase, most traders are placing trades in line with the current trend.
Once the consolidation kicks in, some traders will close while others hang on. As consolidation persists, an increasing number of trend traders will exit, given the stagnant trend, and instead attempt to profit from the consolidation’s movement.
The Shock Reversal
Now, let’s shift gears to the “Shock Reversal”.
The shock reversal is a different beast to the consolidation reversal.
It’s when a trend reversal catches traders, who were riding the previous trend, off guard.
In a shock reversal scenario, there’s no preceding consolidation in the market, suggesting that bank traders likely haven’t been able to place many trades in the direction of the reversal.
In these situations, the banks may either trade at the early stages of a reversal—before it becomes apparent to everyone—or hold until the market stops trending and enter onto the first pullback or consolidation they see form.
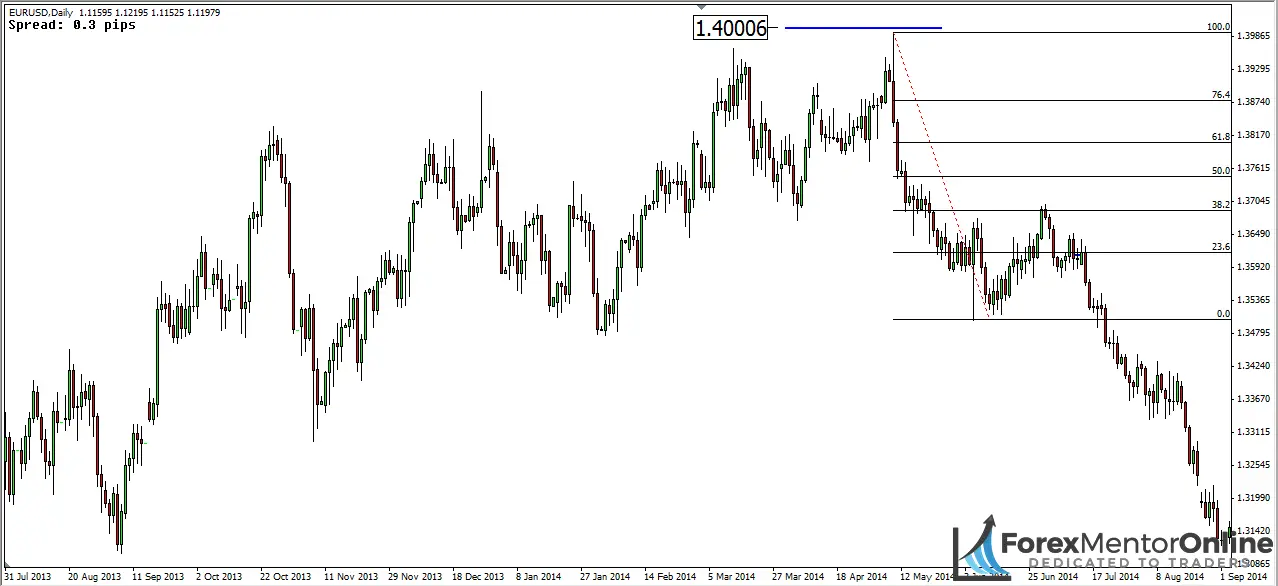
When the EUR/USD reversed into a downtrend back in 2014, we witnessed a drop for 34 days, followed by a pause and a retracement against the initial downward move.
It was an unexpected turn of events that caught many by surprise.
Bank traders were quick to spot this and went short at the top of the downward move. Although there wasn’t any preceding consolidation that could have served as a signal for banks to place short trades, the run-up to the 1.40000 level was highly publicized by financial media.
Much of the news pouring into the Forex Factory news feed at the time revolved around speculation on whether the market would breach the 1.40000 level.
All this media buzz generated a ton of anticipation among traders, leaving them on the edge of their seats, questioning, “Will the market finally break the level?”
The moment of truth arrived with the release of ECB news.
As the news broke, the market surged upward, producing a massive bullish large-range candle.
If you’ve spent some time browsing through my site, you’ll know a significant market move accompanied by a large-range candle tends to prompt hordes of retail traders to place trades in the direction of the candle.
What made the situation with EUR/USD unique was the intense hype surrounding the potential breach of the 1.4000 level.
Traders were almost pre-programmed to anticipate the market breaking the level.
So, when they saw the bullish large-range candle forming, the majority likely went long, thinking the market was about to shatter the 1.4000 barrier.
Sensing an opportunity, bank traders capitalized on the buying frenzy to place sizable sell orders.
Once the retail traders’ buy orders were swallowed up by the bank traders’ sell orders, the market began its descent. The decline forced those who had gone long to close their trades at a loss, contributing significantly to the downward momentum seen in the first downward thrust.
In essence, the banks managed to leverage the market hype and retail traders’ actions to their advantage. This shows how crucial understanding market psychology and broader trends is in Forex trading.

Here we’ve got another shock reversal, but this time, it’s from the 1-hour chart of AUD/USD.
You see, even though both shock reversals come from different currencies and timeframes, the psychological impact on traders caught in the shock reversal remains consistent. Here’s the kicker: in the EUR/USD example, we had millions of traders buying their way up to the 1.4000 level.
Yet here, we have a much smaller group of traders buying before the reversal.
However, when that initial drop hits, their reactions are the same.
All the traders who were long promptly close their trades, leading the market to fall a fair distance before hitting the brakes and retracing nearly 50% of the swing down.
So, what’s crucial about these shock reversal situations?
You need to understand that after the market reverses from its previous direction, there will be a momentary pause. When this pause begins, the market will either consolidate or retrace. Now, if it does retrace, it won’t breach the 50% Fibonacci level.
Why is that, you ask?
Well, it’s all about what the reversal prompts the retail traders to believe.
When the market reverses unexpectedly, traders with open trades in the direction of the preceding movement scramble to close their trades at a loss, which only further amplifies the reversal, depending on how many traders had trades open in the direction of the prior trend.
If the reversal is substantial enough, it will entice a swarm of traders to enter in the same direction.
This leaves no room for bank traders to orchestrate a deep pullback scenario because the market will have reversed too drastically, leading retail traders to dismiss the likelihood of the market continuing in the direction of the prior trend.
For a deep pullback to occur, retail traders need to harbor at least a shred of belief the market can continue in the direction of the earlier trend. But, in a shock reversal, the reversal is so massive that traders don’t believe the market will continue trending in the prior direction.
As a result, they enter in the direction of the reversal.
When the banks start cashing in on the trades that triggered the reversal, the market won’t manage to retrace a significant portion of the reversal movement. Why? Because most retail traders will now be riding the new trend in the direction of the reversal move.
The Deep Pullback Reversal
The deep pullback reversal as the final chapter in our trend reversal saga.
The goal of the deep pullback reversal is to dupe retail traders into thinking the previous trend will continue. The bank traders use this cunning move to stack more trades at a better price in the direction they intend the market to reverse.
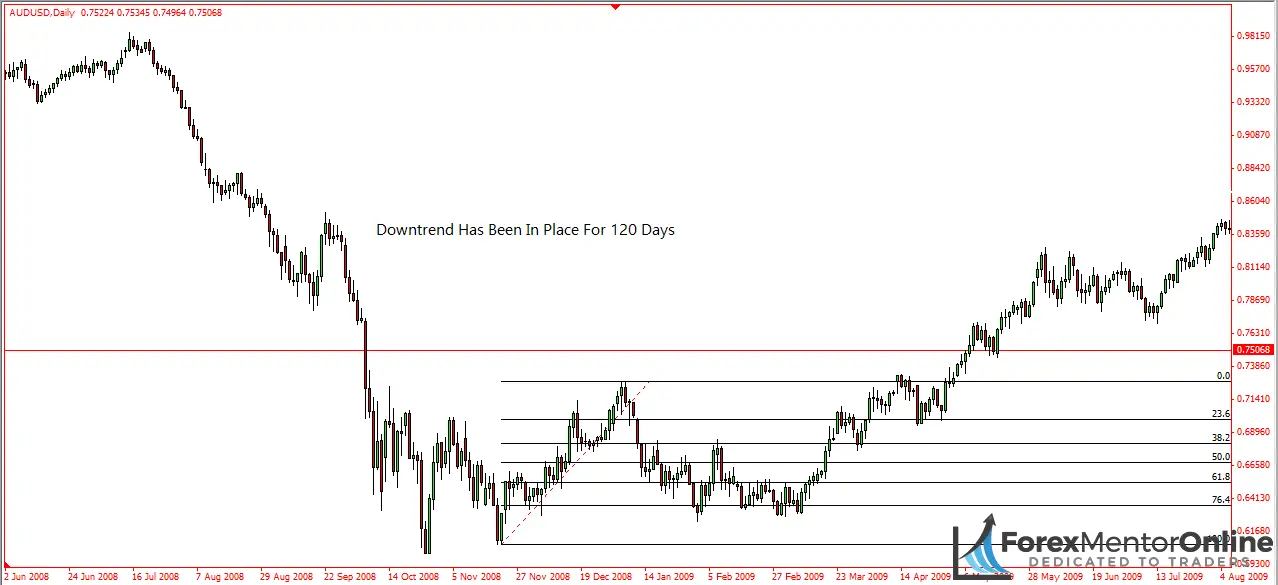
Let’s hit rewind and go back to the end of the 2008 crash on AUD/USD. Something quite interesting happened there – a deep pullback reversal came into play.
At this time, AUD/USD had been in a downtend for a whopping 120 days. The sheer magnitude and duration of this downturn had traders convinced the market was headed for even lower lows. So, when they saw a pullback, they thought:
“Aha! Here’s our golden ticket to short this trend.”
The end of the pullback marked the start of another downward swing.
The new swing prompted thousands of retail traders to pile into the market, placing short positions. Why? They were convinced the downtrend was continuing.
But here’s the twist: the market paused its descent near the swing’s lows and began to climb. This upward movement caught the retail traders, who had gone short, off guard.
So, they scrambled to close their short trades, which resulted in a flurry of buy orders entering the market. This surge in buy orders, from short traders exiting their positions, is what primarily fueled the upward move you see from the 76.4% Fibonacci level.
Here’s the key point:
In any deep pullback scenario, the size of the movement generated by the deep pullback reversal depends heavily on how many traders are playing their cards on the deep pullback itself.
In the example above, masses of traders went short, banking on the continuation of the downtrend. When this didn’t pan out, these traders had to eat humble pie and close their trades, which in turn propelled the market against the downtrend, creating a new short term uptrend.
In essence, they attempted to ride a wave that ended up being a ripple, but inadvertently created a tidal wave in the opposite direction.
That’s forex for you!
Trend Reversals And Time-Frames
Now we’ve delved into the three types of trend reversals and what they imply about the trend, let’s quickly talk about a key point:
The three trend reversals we’ve just unpacked are universal, applying to all time-frames alike.
Whether you’re seeing a trend on the 1-minute chart, the 5-minute chart, or any other time-frame of your choice, the trend will always reverse in one of those three ways. Sure, the representation of these reversals may vary, with differences in candlestick structure and swing structure.
Still, their defining characteristics will always be present.
In a deep pullback scenario, the market will retrace deep into the prior swing.
In a shock reversal situation, the market won’t close beyond the 50% retracement level.
And in a consolidation reversal, you’ll see a consolidation where the swing highs and lows form close together before the market reverses direction.
Regardless of the time-frame they’re operating on, traders’ psychology remains consistent.
Let’s say a group of traders on the 1-minute chart see’s the market moving lower, then pulling back before falling further. In this case, they’ll place sell trades. This behavior mirrors that of traders on the daily chart who see the market dip, make a pullback, and then dip again.
The only difference between trend reversals on different time-frames lies in the number of traders affected by the reversal: the longer the timeframe, the more traders affected.
The Bottom Line
Predicting a trend reversal with 100% accuracy?
That’s not happening.
However, by understanding the structure of the reversal unfolding and its implications on the retail traders’ psychology in the market, you can, with a reasonable degree of certainty, discern what the banks aim to achieve with the reversal.
You’ll also get a sense of the limits on where the market should head during its reversal phase.