Have trouble drawing and finding support and resistance?
Sick and tired of trading levels that never work?
Hold on to your hats, I’m here to help…
Support and resistance levels form the bedrock of many trading strategies. But finding and drawing the correct levels proves challenging for most traders.
Luckily, there is a way to quickly identify and draw the right levels…
I’m talking about support and resistance indicators.
By applying maths and algorithms, support and resistance indicators can identify and mark S & R levels on the chart for you AUTOMATICALLY. So, no more struggling to find the right levels and praying you’ve drawn them correctly.
Now, the indicator does all the work for you.
Pretty cool, eh?
Support and resistance indicators are all the rage these days, so knowing which works best and provide the right features can be a bit of a pain.
To help you get sorted, here are my top 3 picks…
Before We Start: What Is Support And Resistance?
Before we get to my favourite support and resistance indicators, let’s quickly go over what support and resistance actually is, for anyone who’s still unsure.
In short: support and resistance is a concept based on supply and demand.
In financial markets, the forces of supply and demand create the price movement we see. Rises, declines, trends, and consolidations all form due to buyers and sellers interacting with one another, generating supply and demand.
Now, supply and demand is ever-changing, which means points where massive supply or huge demand often build up at specific prices.
In trading, we call these support and resistance levels.
These levels act as barriers for price moving higher or lower, hence the names “Support” and “Resistance”. Significant supply or demand enters the market at these levels, causing price to usually reverse and move the other way.
Support levels stop price from moving lower
Resistance levels stop price from moving higher.
Here’s a quick look at the two levels…
Support Levels

Points where major demand exists, Support levels are high probability locations where bullish reversals could take place.
Resistance Levels:
Resistance Levels

Resistance levels are the opposite of support levels; these are points where massive supply exists.
Expect bearish reversals from these levels.
Both support and resistance levels form when price reverses from the same/similar price multiple times. That shows significant demand or supply enters the market at this price, creating a support or resistance level.
To find and draw the levels…
1. Identify multiple reversals that occurred around the same spot.
2. Mark a line through the reversals; include as many as you can.
3. Wait for price to return and form a price action pattern.
If done correctly, you should have a valid support or resistance levels.
To learn more, check out my support and resistance guide.
Important Note: Supply and demand zones also form due to the forces of S & D but differ to support and resistance levels both in why they form at their presence in the market.
Don’t get confused and think S & D zones = S & R levels, because they’re NOT the same.
Why Use A Support And Resistance Indicator?
Support and resistance levels exist all over the charts, on every pair and every timeframe. To use the support and resistance successfully, you must know how to identify the strongest levels and draw them correctly on the chart.
For most traders, this is where the problems begin.
Anyone who trades support and resistance knows that finding the right levels and drawing them correctly can be a right pain in the ass.
However, I can help…
Enter: Support and resistance indicators.
If finding and drawing support and resistance levels is a pain, why not have an indicator do it for you automatically? That’s what support and resistance indicators provide. Rather than struggle finding and drawing the zones, the indicator does everything for you.
Take a look…

All the support and resistance levels above, every single one, has been automatically identified and marked by an indicator – which we’ll look at in a minute.
There are many S & R indicators out there, all with their own features and quirks.
Here are my top 3, along with how to set up and begin using them…
Indicator #1: Support And Resistance By Kaleboraciy
Tradingview comes equipped with a few useful support and resistance indicators, but “Support And Resistance Zones” by Kalesmart easily takes the cake as one of the best.

Created by Kaleboraciy, this cool little indicator automatically marks key support and resistance levels for you on the chart. So far, so much like every other S & R indicator. However, there’s one big difference…
Rather than mark the levels using lines, the indicator instead marks the levels as zones.
This may not sound like a big deal, but believe me, it is.
Zones make support and resistance far more accurate and easier to trade than using the levels as single lines.
I mean, tell me…
How many times have you seen price come within a few pips of a level but then reverse without touching and providing any entry signal?
This happens ALL THE TIME!
And it’s because the levels exist as lines.
As zones, this rarely happens; price always touches the zone.
That’s why this is such a great indicator!
Now, keep in mind…
The indicator doesn’t actually draw support and resistance zones according to the correct rules.
For that, you must read my other article on S & R and follow the instructions.
However, by simply expanding the levels into semi-qualified zones, it does give you a better idea of where the right zones lie. And being marked as a zone makes it way easier to see how the levels are drawn into zones.
Ideal Settings
The “Support And Resistance by Kaleboraciy” indicator comes ready to go out of the box. The default settings will do you fine and show the correct zones.
One setting you should consider changing, though, is “Pivot Points Length”.

The indicator uses pivot points to determine where the levels lie. So, by changing this setting, you can decide how fussy the indicator is at identifying levels. A small number means more levels will appear, whereas a high number will only leave a few levels showing.
It’s best to edit the pivot point length based on what timeframe you use.
- For shorter TF’s, a small number will show the correct levels.
- For longer TF’s, a high number will reveal the right levels.
You can also edit the “Inaccuracy” option to further fine-tune how fussy the indicator is and which levels appear.
Indicator #2: SSI Support And Resistance Indicator
Wish there was a simple support and resistance indicator that locates the right levels, automatically marks them as zones, AND works with MT4?
Sounds too good to be true, doesn’t it?
But it actually exists…
Its name: the SSI Support And Resistance Indicator.

This sweet little indicator, which you might mistake for a supply and demand indicator at a glance, automatically identifies support and resistance levels and converts them into zones. Basically, what the prior indicator does, but with better zones and on MT4 instead of Tradingview.
Compared to other indicators, the SSI has a couple of notable features aimed to make finding and trading the levels a breeze.
For example:
See the small number in the far left of each zone?
That tells you how many times price has touched a level – super useful when weighing up how powerful and useful a level may be.
Also, check the zones themselves…
Unlike the Tradingview indicator, the zones are light colors. This makes observing price behind them a lot clearer. The zones show the support or resistance level, too, so you can see where the real levels lie.
SSI Support And Resistance Indicator (2215 downloads )Keep in mind:
While super useful, the SSI Indicator DOES NOT mark support and resistance zones correctly. You must still redraw the zones using the rules and guidelines explained in my S & R zones article.
Use the indicator to locate where the real zones lie, then mark them using S & R zones article.
Ideal Settings
You can’t really go wrong with the default settings that come with the SSI Indicator, but there are a couple of options worth changing depending on your needs.
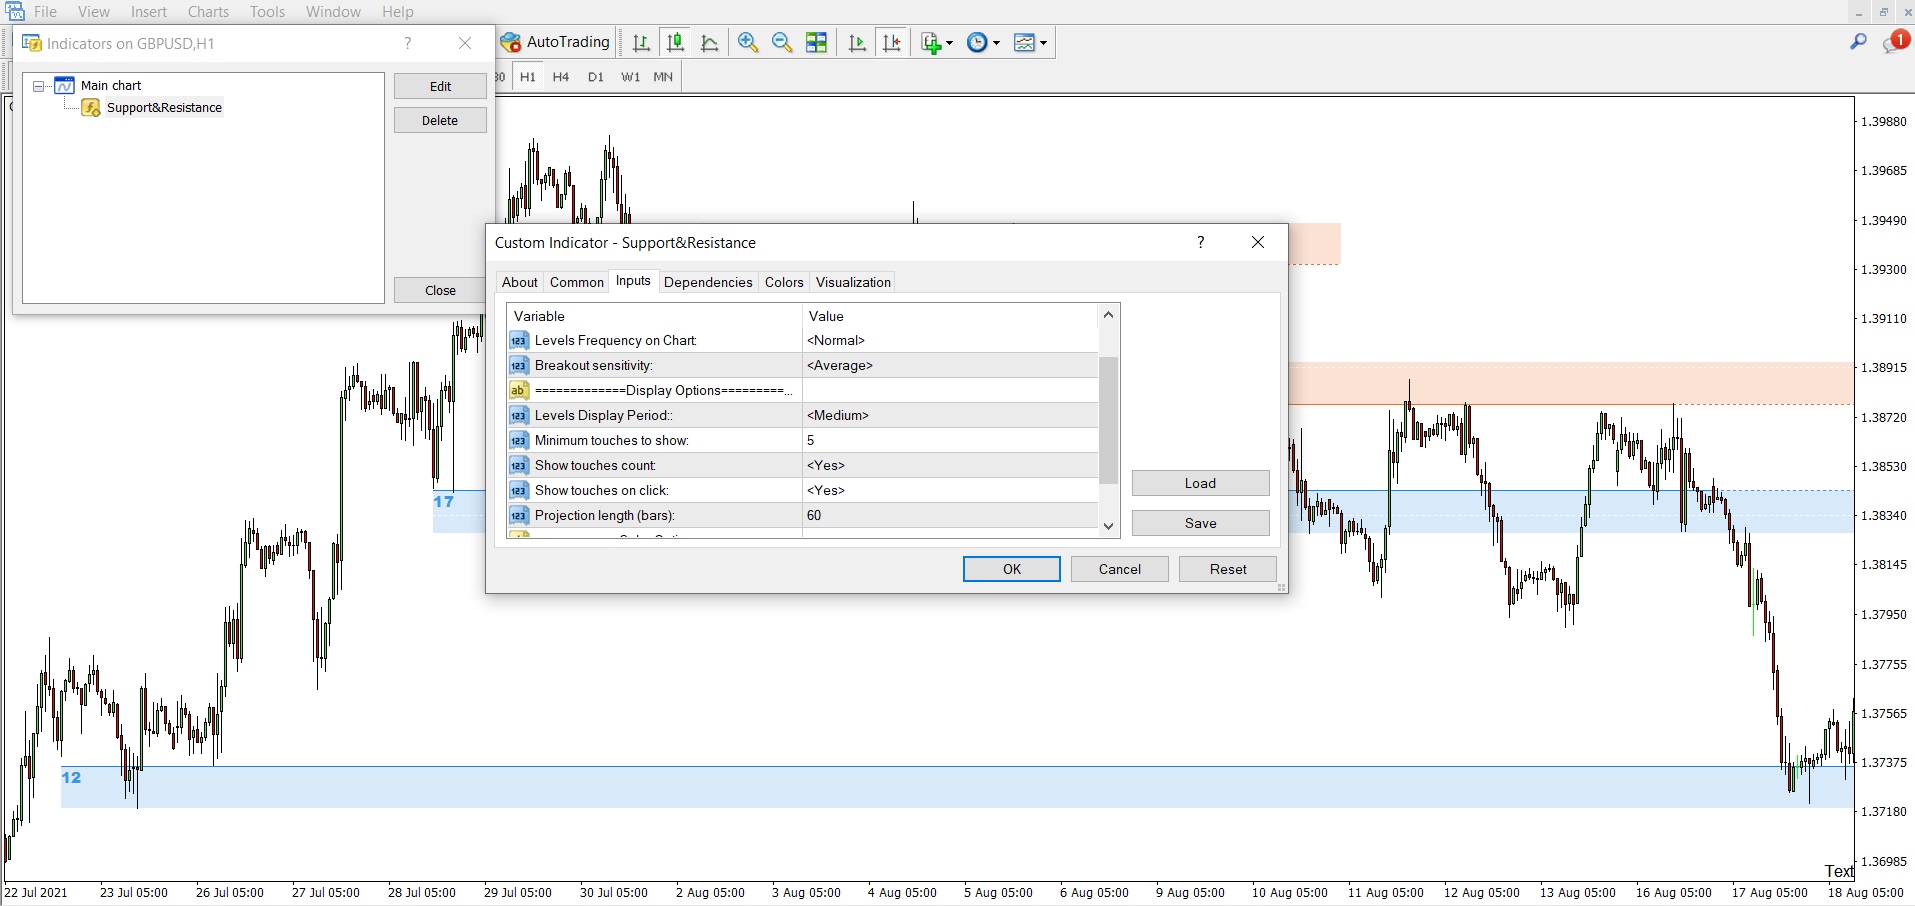
For my money, the two most important are:
• Level frequency.
• Touches to show.
These both change how many support and resistance zones the indicator shows on the chart.
Level frequency directly changes how many levels will show. The three settings are: Normal, Less, and More. Edit these based on what timeframe you tend to use: More for low TF’s, Less for long TF’s, Normal for middle TF’s.
Touches to show lets you edit the number of touches needed for a level to be valid.
The default setting is 5, which means a minimum of 5 touches is required for a level to exist and a zone to form.
In most cases, 5 should be sufficient – that’s the best middle ground.
But if you want to be fussier, you can increase/decrease this number.
How To Add SSI Support And Resistance Indicator To MT4
Before you can use the SSI Indicator, you must manually add the files to the right folders inside MT4 for the indicator to function correctly.
Most of you probably know how to do this already, but for those who don’t, here’s a quick guide.
1: Open the Data Folder on MT4 by heading to “File” and clicking “Data Folder” in the list.
2: Extract your ZIP file to the MQL4 Folder.
If you get a copy file warning, extract the folder somewhere else, then place the files from the folder into their respective folders – experts, scripts, indicators, etc.
3: Restart MT4 and check the “Indicators” menu to add your indicator.
4: Once the indicator options window opens, enable “Allow DLL Imports”.
Most indicators won’t work unless this is selected, so make sure to enable it before adding the indicator to the chart. Also, be sure to check the settings of the indicator in case you want to change any options beforehand.
Indicator #3: MT4 Support And Resistance Lines
Before we come to the end, here’s a classic support and resistance indicator that marks the levels using lines, not zones.
The aptly named “MT4 Support And Resistance Lines” uses an algorithm to locate and mark support and resistance levels. The indicator finds where price is consolidating then calculates the median price using the algorithm.
With that info, the indicator marks a line on the chart.
That line is either a support or resistance level.
There are a few neat features that come with this indicator, but by far the best is the small notice box that appears in the top left of the window.
In this box, you get three key pieces of info…
• Num Pips To Next Support.
• Num Pips To Next Resistance.
• Safe To Trade – Yes, Or No?
Together, these give you a pretty good idea of where the nearest levels are located and whether they are safe to trade or not. A huge help when you are knee-deep in the action waiting for a trade entry to see if a trade entry works out.
MT4 Support And Resistance Lines (1913 downloads )How To Add MT4 Support And Resistance Lines To MT4
To add the support and resistance lines indicator to MT4, follow the same steps I explained earlier.
1: Open the Data Folder on MT4 by heading to “File” and clicking “Data Folder” in the list.
2: Extract the ZIP file to the MQL4 Folder.
3: Restart MT4 and check the “Indicators” menu to add your indicator.
4: Once the indicator options window opens, enable “Allow DLL Imports”.
Ideal Settings
For the support and resistance lines indicator, the default settings should serve you fine.
The only option you might consider changing is the “Number Of Levels”.

This works the same as the “Frequency” option seen on the previous indicator, changing how many levels the indicator shows using three settings: small, medium, and large. Again, base these on which timeframe you’re using.
Small – best for high timeframes, e.g, daily.
Medium – suitable for mid timeframes.
Large – best for low timeframes.
The other options allow you to customize how the indicator displays the lines and set up notification settings, like alerts.
Check them out if you’re interested.