Hello, thank you for taking the time and answer me.
I am very happy and am very grateful.
I try your knowledge to good as possible to implement.
May I ask you a question about an approach?
For example: I see in the day chart a significant “engulfing” (for example, small red candle followed by three times as large green candle), then this is for me a relevant zone, in this case a “demand zone”. Now I’m waiting for entry into this zone and scale down the “time frame”.
Once, say in h1 chart or m30 chart significant “engulfing” forms, this would be my entry as long signal right?
Stop on the last high or low of the “engulfing pattern”.
Would that be correct?
How should one determine its target?
Looking forward to receiving your response, thank you.
Best regards…
My Response:
Yes, once you spot a sizable bullish engulf forming within the zone, you would ideally enter long…
Just bear in mind: If it’s only a small engulf, the market probably won’t reverse.
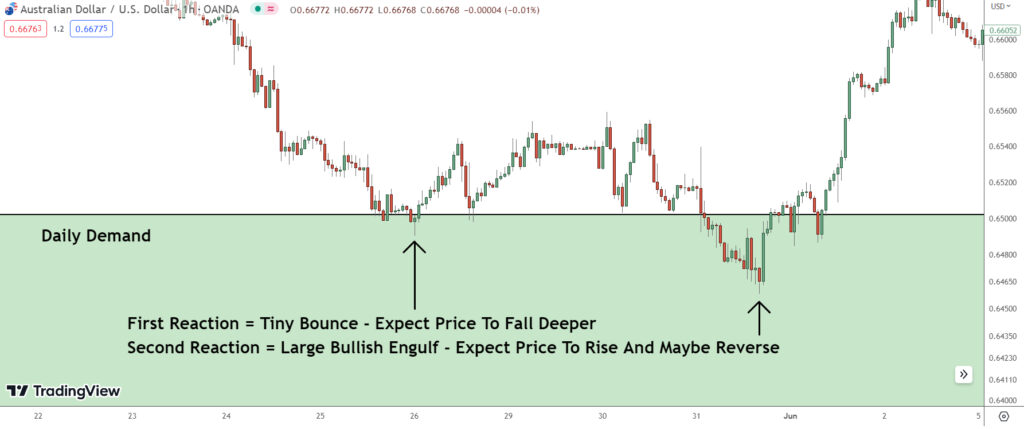
In my experience, when the market enters a daily supply or demand zone, it tends to initially move in the direction the zone indicates, then counter to it before reversing. Essentially, this means as soon as the market enters a daily supply or demand zone, you don’t have to enter as soon as an engulf forms.
Instead, you could wait until the market has made its move out of the zone…
Then, look for an engulf within the zone the move out creates, because more often than not, the market will retract back into the daily zone again before fully reversing.
I hope this clarifies things for you.
Enjoy your weekend!