Richard Wyckoff, a legendary trader from the early 1900’s, developed a comprehensive approach to understanding market behavior that goes beyond simple price action.
His Wyckoff Market Cycle Theory provides a powerful framework for identifying and interpreting the phases of market trends, offering traders a unique perspective on the forces driving supply and demand.
The Cycle’s Four Phases:
- Accumulation:
- Markup:
- Distribution:
- Markdown:
Let’s look at the stages in more detail…
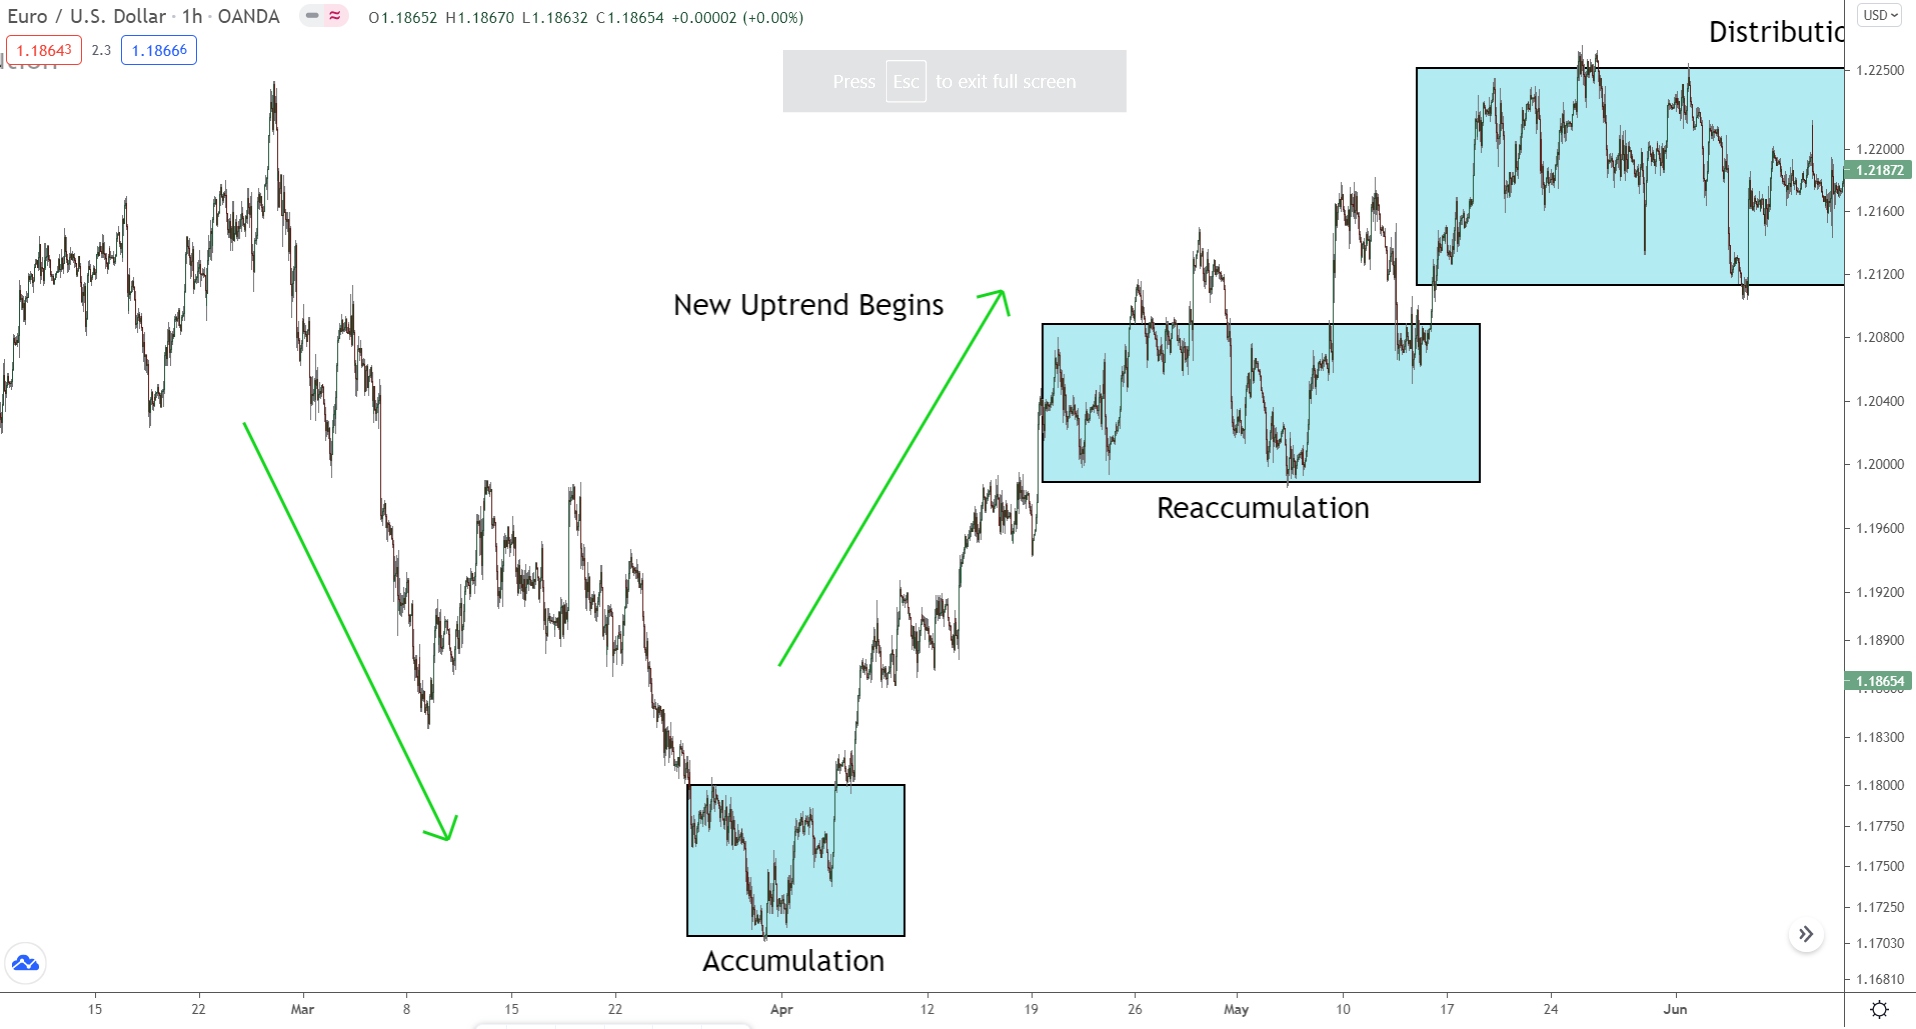
Stage 1: Accumulation Phase
This is where the “smart money” – large institutional investors – begins to accumulate a position in a security at a relatively low price. The price action during this phase is often choppy and sideways, as the accumulation process gradually absorbs the available supply.
Here’s an example…
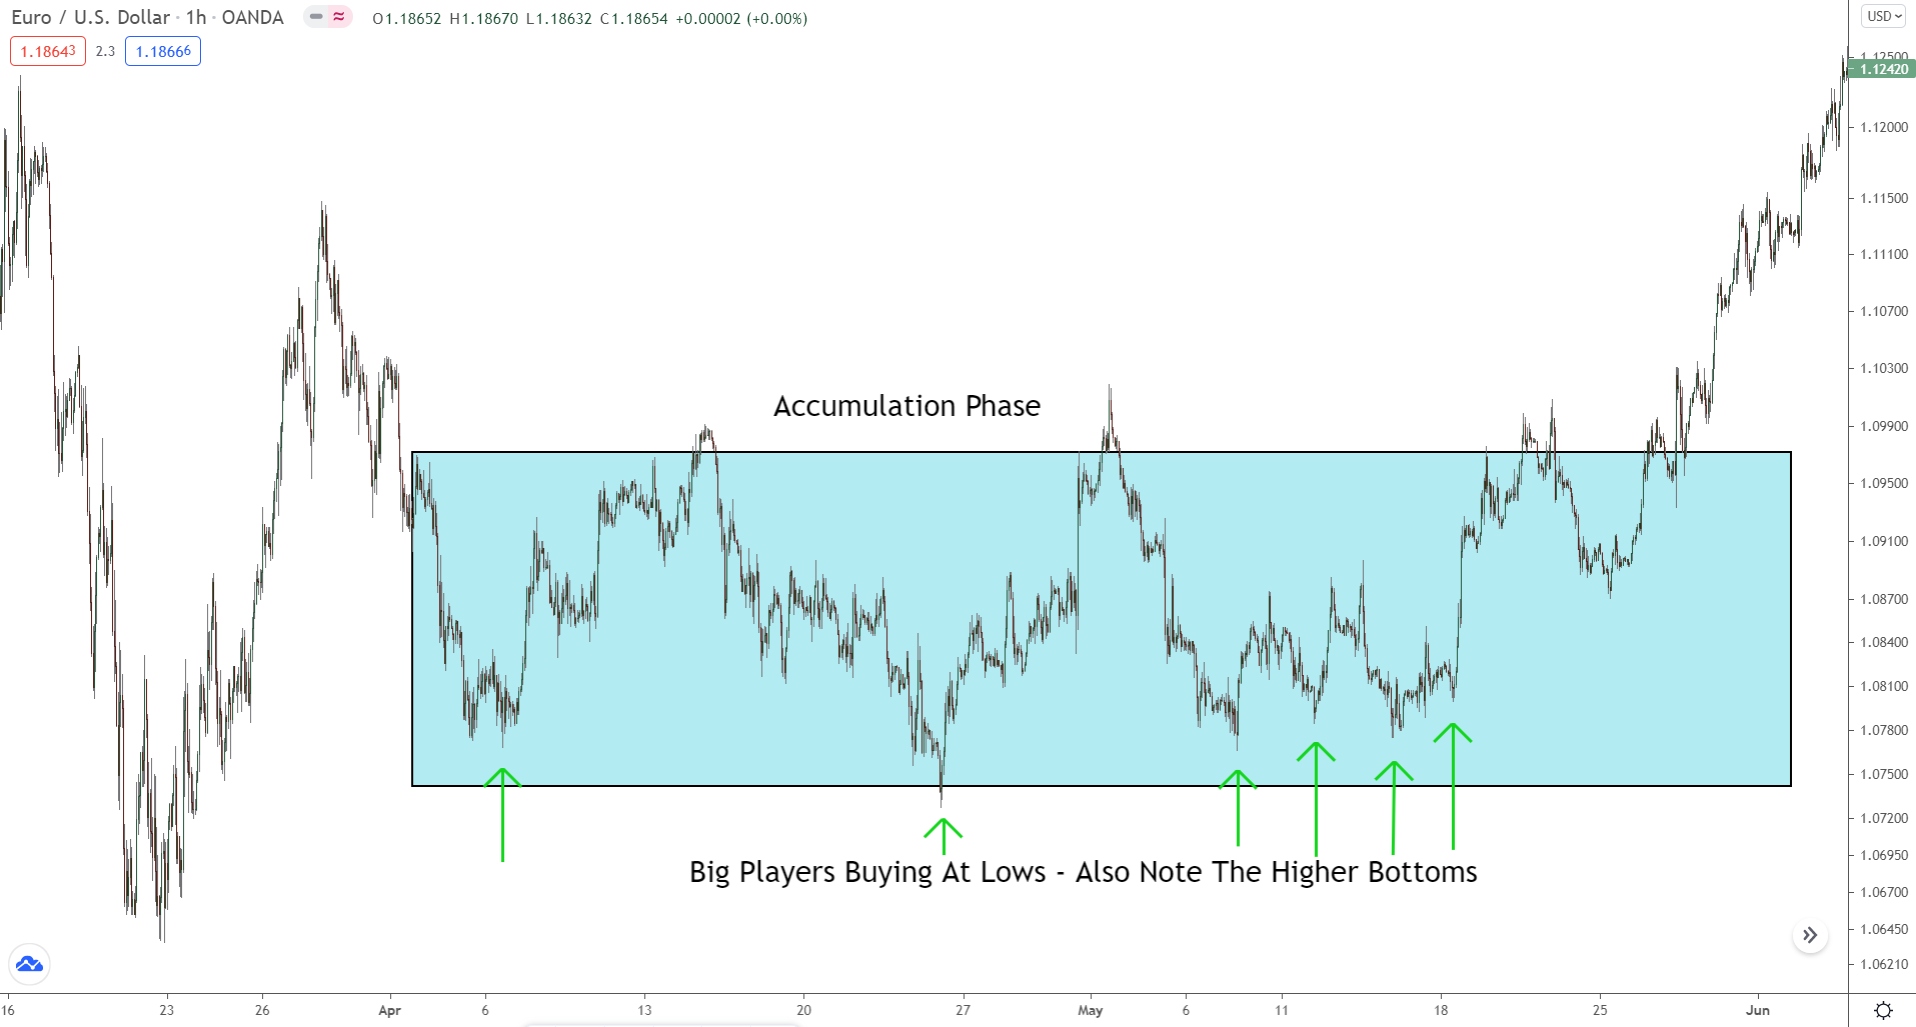
This is the accumulation phase on the 1 Hour chart of Eur/Usd.
As you can see, it’s a consolidation – nothing out of the ordinary.
But that’s only how it seems on the surface…
Behind the scenes, the big players are buying from all the bears entering due to the downtrend and building a massive long position to set off a new uptrend. Price consolidates because the big players buy gradually, so other traders don’t catch on to their plans.
To spot accumulation, watch for two signs…
1) long preceding downtrend/down move
Accumulation always initiates a new uptrend, which only happens after long downtrends. Once everyone trades in the same direction, the big players can’t make money anymore.
With long downtrends/down moves, most traders are short.
The longer the downtrend/down move, the more who are short. So, if consolidation follows an especially long downtrend, chances are its accumulation for a new uptrend.
2) 2 higher bottoms within the range
Higher bottoms (lows) in the consolidation often suggest the big players are accumulating. Especially if they form at similar prices. Due to their size, the big players usually split their trades into smaller chunks to place them without upsetting price too much.
On a chart, that often appears as lows forming at similar prices.
Each low being a new trade, only placed at separate times.
If you see multiple lows form at similar prices, accumulation is probably beginning.
Stage #2: Markup Phase (Uptrend)
Once the smart money has accumulated a sufficient position, they drive the price higher. This is the upward trend phase, characterized by rising prices and increasing volume. The markup phase is characterized by higher highs and higher lows – like all uptrends – interspersed with smaller accumulation phases.
You can see this below…
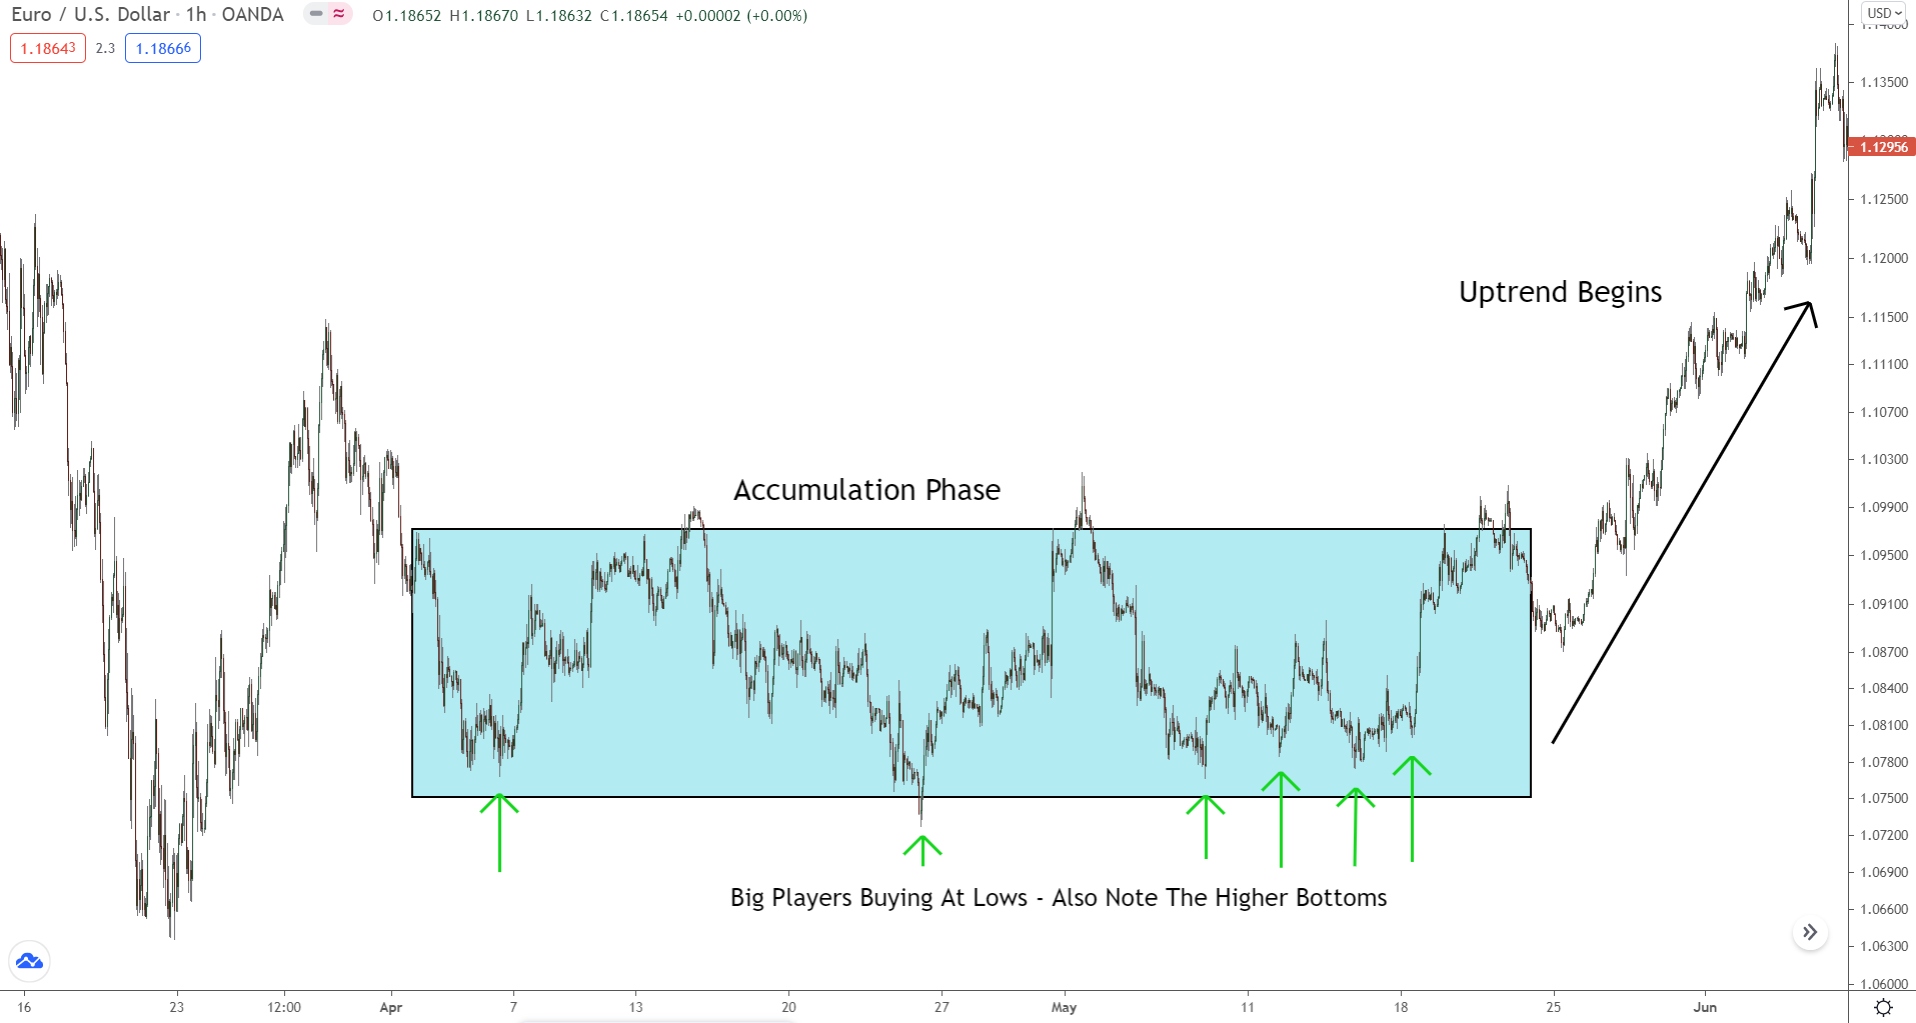
After the accumulation phase, price breaks higher.
The uptrend is now underway, and we see smaller accumulation phases.
With forex being fractal, the Wyckoff cycle occurs on all timeframes simultaneously.
In other words, the overall cycle seen above consists of smaller cycles on the lower timeframes. Together, the cycles create each other, leading to the uptrend we see. That’s what the tiny accumulation phases are – the smaller cycles completing.
During the markup phase, we also see a shift in psychology…
The breakout signals to normal traders a new trend may be beginning.
Many begin jumping in long, which pushes price higher.
The banks start to profit, and more traders enter long.
As the new uptrend continues, more traders become aware of its existence. For the big players, this creates a problem because they can only profit if most other traders are losing – as forex is zero-sum; the losers pay the winners.
This is where we sometimes see the re-accumulation phase.
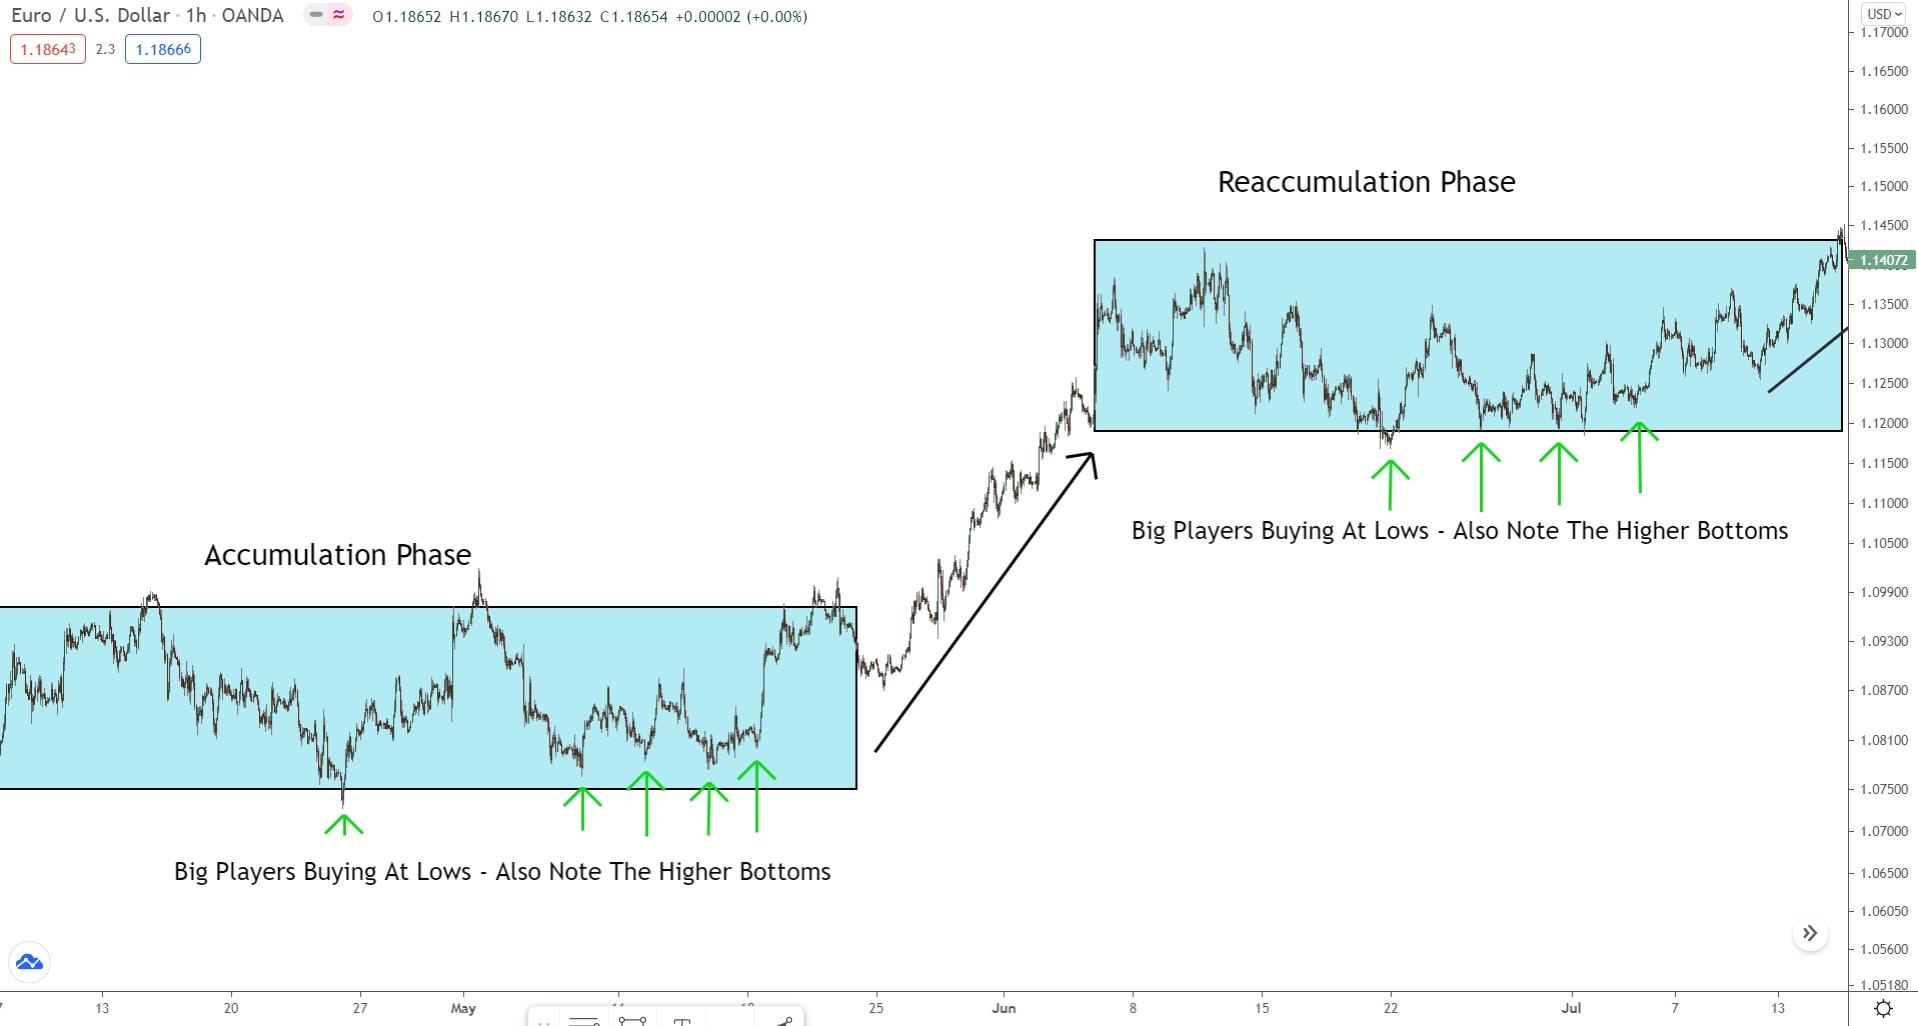
In this phase, the big players cause another accumulation phase to #1 confuse the market, and #2 add more buy positions for the next phase of the trend.
They take profits; price begins to consolidate.
The longs begin to close; price isn’t heading higher anymore.
When the longs close, they use sell orders. The banks use these sells to gradually place their own buys until eventually, price breaks higher, and the new uptrend begins.
Now the process repeats itself all over again.
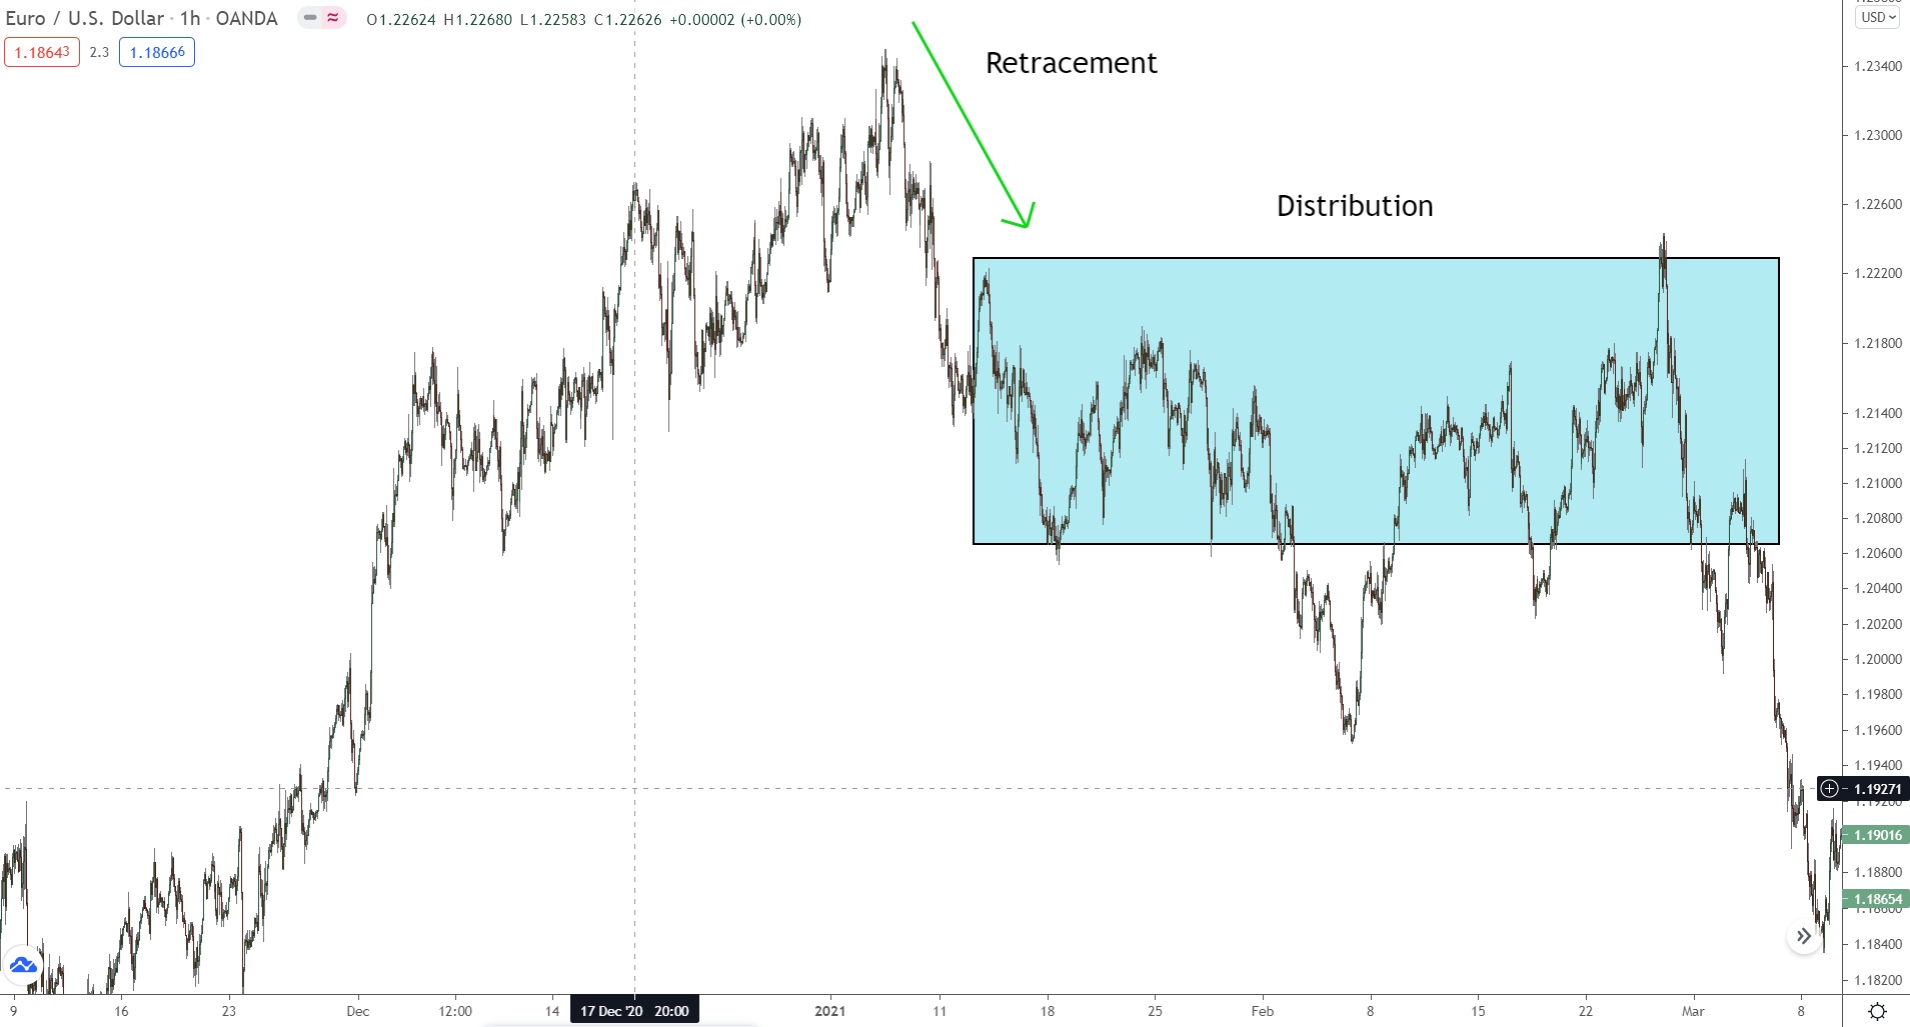
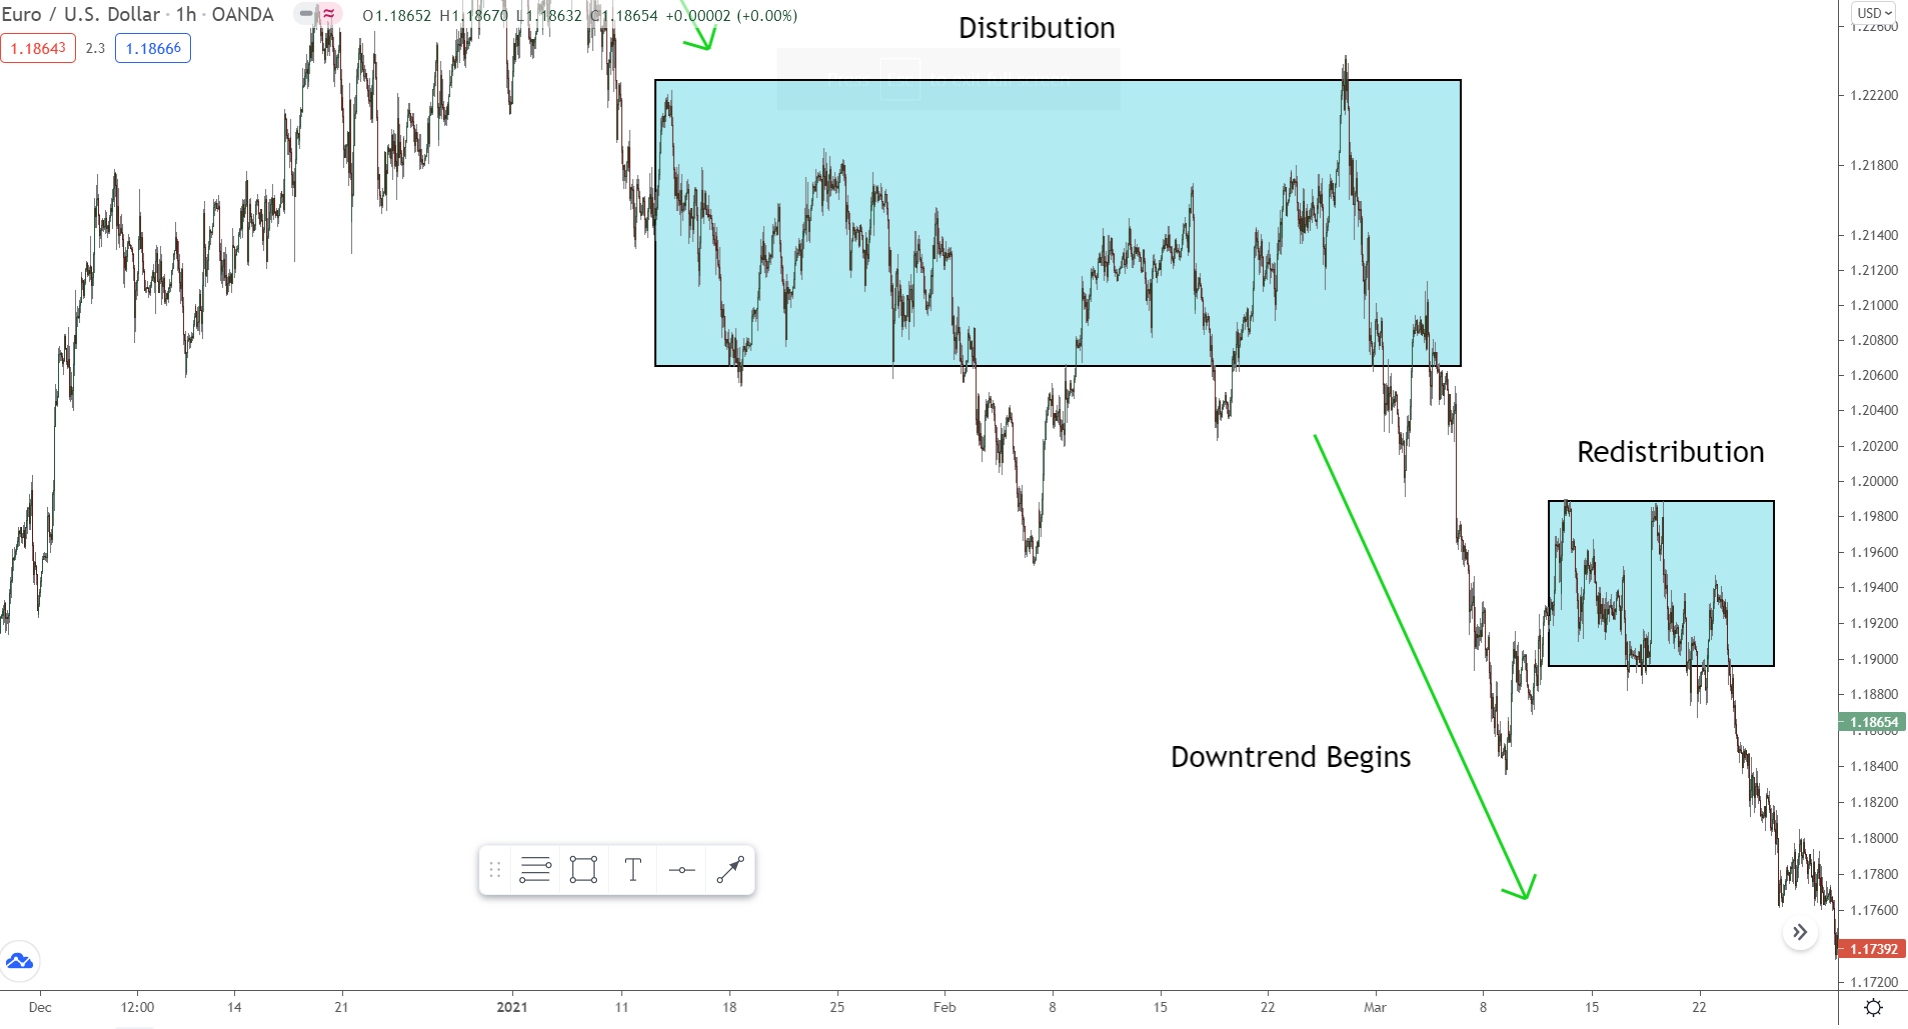
Stage #3: Distribution Phase
Okay, here’s where things get tricky…
At the top of the market, the smart money starts to distribute their holdings, selling into the buying frenzy of less-informed traders. Price action becomes more erratic during this phase, with lower highs and lower lows forming.
Here’s an example…
Now, since the banks are taking profits, the distribution phase can lead to two different cycle outcomes:
#1 A Markdown Phase
#2 Another Markup Phase
We don’t know why the banks are taking profits; maybe they don’t think the trend will continue, or maybe they expect price to retrace slightly. So, we can never say for sure which cycle outcome will follow the distribution phase.
That said, there are signs…
For one, the big players will only initiate a trend reversal if they can no longer profit.
Remember, the longer a trend exists, the more traders who catch on and enter the same way.
That’s a problem, because…
If everyone trades in the same direction, the banks can’t profit anymore; they need losers!
Being zero sum, the only way to profit in forex is from others losing. When everyone trades the same way, most aren’t losing anymore, so the banks can’t profit. They must end the trend and take price the other way.
With that in mind, we know if a distribution phase begins after a long uptrend, chances are a trend reversal could be near.
Rather than see a continuation (markup phase).
We’ll instead see a downtrend begin (markdown phase).
And usually, this is the case…
The distribution phases often results in a new downtrend.
We see a trend reversal rather than a trend continuation.
The distribution structure can also provide clues:
Normally, the consolidation will fail to create higher bottoms, with lower tops also appearing – both tell-tale signs a sell-off is taking place.
Stage #4: Markdown Phase (Downtrend)
Once the distribution is complete, price begins to fall as supply overwhelms demand. This is the downward trend phase, marked by declining prices and often increasing volume as panic selling sets in. Mark-down is characterized by consistent lower highs and lower lows, showing a gradual decline in price over time.
Here’s how it looks…
Again, see how more mini consolidations appear during the trend?
These are tiny accumulation/distribution periods on a smaller scale.
The Wyckoff cycle is factual; the cycle on one scale (timeframe) forms due to the same cycle on a lower scale (smaller timeframe). The downswing marked with an arrow, for example, forms due to the stages occurring on a lower TF.
Eventually, the markdown phase ends…
Now, we see the entire 5 stage process begin again:
- Accumulation (consolidation)
- Markup (uptrend)
- Distribution (consolidation)
- Markdown (downtrend)